Too much data? Use the command line
Too much data? Use the command line
Too many files, too much data? Chaos? Finding trends over time usually means we need to combine different datasets from different years: files that are not designed for this purpose and are usually very big.
We need to clean the data as fast as possible and do this perfectly accurately, but how? When the files are this big, copying, pasting and manually filtering the data we want is not the way to go, and this can also lead to accidental errors.
So, I recently came across an incredibly useful tool for journalism (read: Code for South Africa director, Adi Eyal showed it to me), to make our lives easier: csvkit. (Yes, working with coders is very useful!) The tutorial is very clear, but this blog is just to introduce you to the tool using a practical example.
Let’s imagine that you have the causes of deaths of school children from around the country over a five year period; one file for each year. We are going to pretend they all came in csv format (next time we can talk about converting data from different formats to csv) and you are just looking at deaths caused by HIV/Aids, but we want them all in one dataset so we can create graphics and see trends. But how do we do this quickly?
Ok, so first you have to install csvkit by open up the terrifying black window called command line or terminal (note that this applies to people using Mac, Ubuntu or Linux, but commands for Windows will be different.). Once you open it, type the following command and wait until it is installed completely:
sudo pip install csvkit
(See here for installation instructions.)
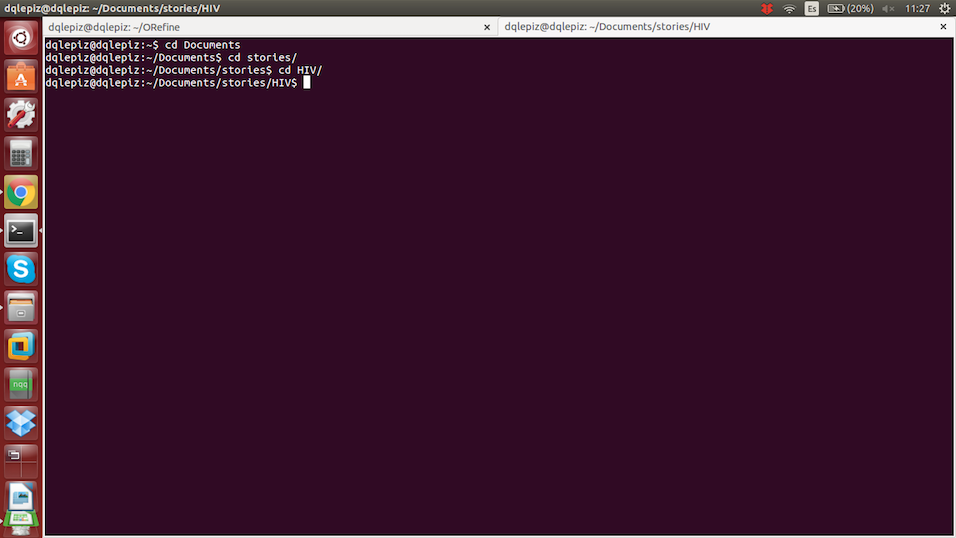
You will need to have one single folder where you put all your data: 2010.csv, 2011.csv, 2012.csv, etc. Go to that folder following your computer path. By typing “cd” you will be telling your computer to move to a different folder (exactly the same thing as double clicking in your desktop folder). For example:

You will see how it starts to show the path you are on. Once you are in the directory where your data is you can start cleaning your data:
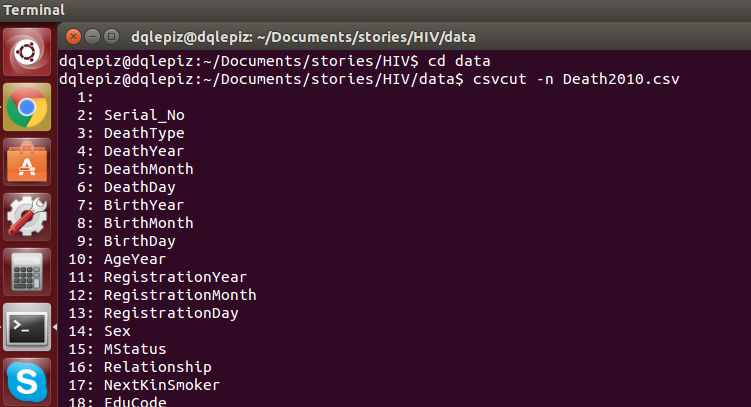
Read the columns to understand what is in the dataset.
You need to type the following command and you will see the index and name of each column in your dataset:
$ csvcut -n yourdatasetname.csv

Typing that command will help you understand what is in the dataset and what order it is in. Now you can decide which columns you are going to choose.
Choose the columns you want for each dataset and create a new document.
For this example, I have decided to use the year (4), province (14), gender (26) and the underlying cause of death (45). You can use the columns’ names or index. Now type the following, and wait, don’t type enter yet:
$ csvcut -c (index of the colums you want) 1, 2, 3 yourdataname.csv

Create a new file combine the two into a single file.
As you can see in the previous screenshot you can create a new file using the icon “>” you will be saying “create a new file of this selection” and give it a new name.
Make a single file.
Once you have done this with all your files, you can put them all together. Another useful command is “cat”, it will allow you to combine all the data just by listing the documents:
$ cat (list all your files) > alldata.csv

Filter the results you want.
Now you have all them in one file (before you join them, make sure that all the columns are in the correct order so you are joining “apples” with “apples”). We know that HIV/Aids deaths are registered under the code B20-B24, according to the data. Now it is time to filter them, and for this you will need to use the csvgrep functionality + a regular expression:
$csvgrep -c Underlyingcause -r “B20|B21|B22|B23|B24” alldata.csv > filtered.csv

This can basically be read as: “give me only the rows when column ‘underlying cause’ matches the following criteria: ‘B20|B21|B22|B23|B24’, from ‘this file’ and with the result make ‘a new file’.
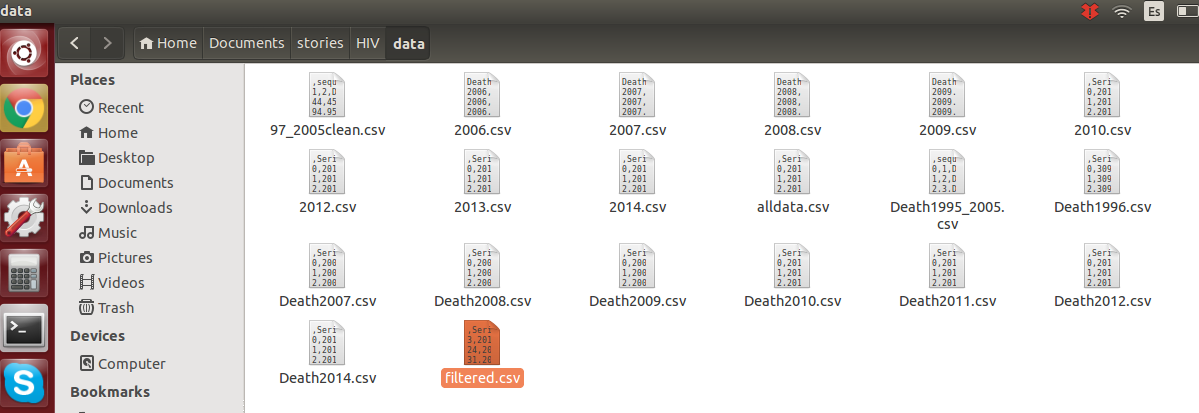
Done! Now you have one file with the columns you need, filtered by the criteria you have decided on. You can go to the folder and you will see your new csv file there.

There are many ways to do this. For example using pipe “|” will speed up the process. Take a look at the tutorial. Experiment, try different ways and use whatever suits you better. The tool has far more uses than this, so take a look at the sql functionalities, statistics, and merging related data.
Enjoy! And remember to share your data!

