Code for SA Blog
Creating an interactive story with CartoDB and Leaflet.js

A technical run-through of how we created an interactive storyboard on informal settlements, with detailed explanations on how we used CartoDB and Leaflet.js.
Opening local budget data

The South African National Treasury is in the process of opening municipal financial data to make it widely available in order to increase visibility and strengthen civic participation. How awesome is that?
Quick and dirty map viz

Taking shortcuts and outright cheating is the hallmark of a great developer. I like creating graphics, both visualisations and pretty maps but I often don't have the time to spend hours making one from scratch. In this blog I'm going to explain the process that I took to create a quick and dirty map navigation tool.
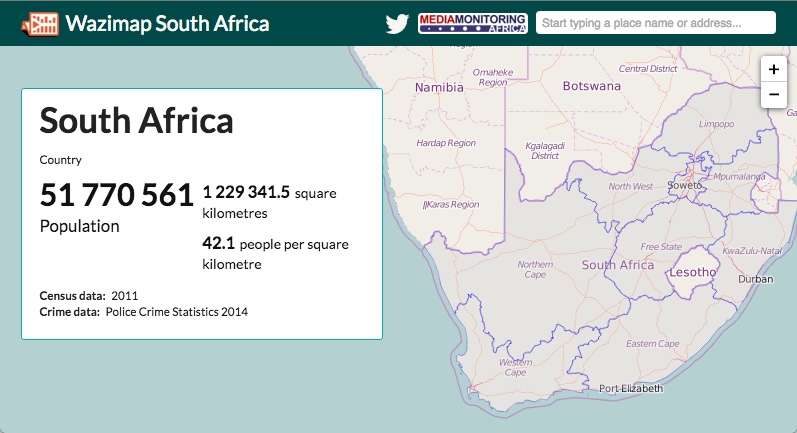
Build your own Wazimap

It's now much easier to build your own Wazimap and help more people find the story behind the data.
Taxclock Budget Tools

Ordinary people often struggle to get their heads around their country’s budget and many pay tax grudgingly as it seems like their hard-earned money just disappears into a fiscal black hole. Yet budgets and tax have a direct effect on ordinary people.
